
Both Teams to Score, commonly known as BTTS, represents one of soccer betting’s most straightforward yet strategically rich markets. It strips a match down to a single question: will both sides find the net? In spite of its simplicity, consistent profitability demands a deeper understanding of team form, defensive records, and match context. What separates sharp BTTS bettors from recreational ones lies in the details examined ahead.
Key Takeaways
- BTTS is a soccer betting market where you wager on whether both teams will score at least one goal during a match.
- The two betting options are “Yes” (both teams score) or “No” (at least one team fails to score).
- BTTS odds are determined using metrics like goals scored, goals conceded, expected goals (xG), and current team form.
- Unlike Over 2.5 Goals, BTTS requires contributions from both teams, not just one dominant side scoring multiple goals.
- Key analysis factors include defensive weaknesses, offensive strength, injury reports, and match context like high-stakes fixtures.
What Does BTTS Mean in Soccer Betting?
Both Teams To Score, commonly abbreviated as BTTS, is a betting market in soccer where a wager is placed on whether both teams will score at least one goal during a match. The market presents two options: “Yes” or “No.” A BTTS Yes bet wins with scorelines like 1-1 or 2-1, while a BTTS No bet succeeds when either team fails to score, such as in a 0-0 draw.
Unlike traditional win/loss betting, BTTS focuses strictly on scoring outcomes, independent of match results. Effective BTTS strategies require analyzing team-specific data, including goals scored and conceded. Monitoring BTTS trends across leagues helps identify matches featuring high-scoring teams or defensively vulnerable sides, providing bettors with informed, data-driven opportunities to maximize their wagering decisions.
How BTTS Odds Work at Online Betting Sites?
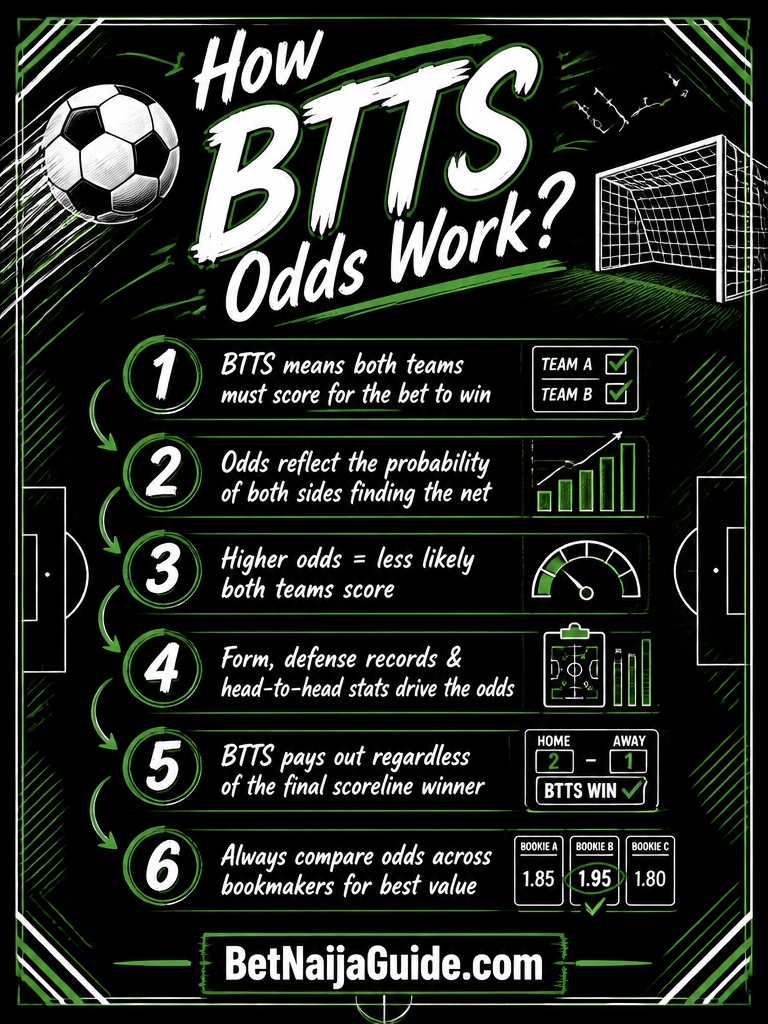
Sportsbooks price BTTS markets by running team performance metrics — goals scored, goals conceded, and historical BTTS rates — through proprietary algorithms that convert statistical probabilities into odds. A line of -120 for BTTS “Yes,” for example, reflects an implied probability of roughly 55%, a figure consistent with higher-scoring leagues like the Bundesliga and Eredivisie. These odds are not static; sportsbooks adjust them in response to team news, weather conditions, and shifts in public betting volume, meaning sharp bettors monitor line movement as a signal of where informed money is flowing.
Sportsbook Pricing Explained
Pricing for BTTS markets is built on statistical models that evaluate team performance metrics, including goals scored and conceded, attack strength, and defensive vulnerabilities. Effective betting strategies require understanding how sportsbooks translate these metrics into odds interpretation.
Key pricing factors include:
- Implied probability — odds reflect the likelihood of both teams scoring
- Market range — BTTS odds typically span -120 to +200 depending on match context
- Statistical indicators — xG metrics and BTTS percentages directly influence pricing adjustments
- External variables — injuries, team news, and betting patterns trigger pre-match line movement
Higher-scoring matches typically produce lower BTTS Yes odds, reflecting increased scoring probability. Bettors who understand these mechanisms gain a structural advantage when maneuvering binary BTTS markets independently.
BTTS Odds Movement
Understanding how BTTS odds move requires looking beyond initial pricing into the live mechanics of sportsbook adjustments. Odds shift in response to injury reports, team news, weather conditions, and incoming betting volume. When sharp money targets one side, books recalibrate to manage liability exposure.
For bettors applying BTTS strategy tips, tracking line movement reveals where the market assigns genuine confidence in teams’ scoring capacities. A move from +110 to -105 on BTTS Yes signals growing market consensus around both teams finding the net.
Thorough BTTS market analysis treats odds movement as informational data rather than noise. Early pricing reflects statistical modeling, while late movement reflects collective intelligence. Monitoring these shifts systematically gives bettors a structural edge before kickoff.
Types of BTTS Bets You Can Place
Bettors exploring BTTS markets will find several distinct wager types, each carrying its own risk-reward profile. Understanding these options sharpens BTTS strategies and refines BTTS tips for more disciplined wagering.
- Standard BTTS — Both teams must score at least once, independent of the final result.
- BTTS and Result — Combines both teams scoring with a predicted match winner, elevating potential payouts.
- BTTS Both Halves — Both teams must score in each half, significantly increasing difficulty alongside reward potential.
- BTTS and Over/Under — Links both-teams-scoring predictions to total goal thresholds, enabling layered analytical approaches.
A fifth variant, BTTS No Draw, demands both teams score while eliminating draws as an acceptable outcome, compressing the margin for error considerably.
Which Stats Actually Matter for BTTS Picks?
Identifying which statistics carry genuine predictive weight is crucial for making informed BTTS selections. Key performance metrics — including BTTS percentage, average goals scored and conceded, expected goals (xG), and shots on target — provide a quantitative foundation for evaluating scoring probability on both sides. Similarly significant is a thorough analysis of each team’s offensive output and defensive vulnerabilities, as the interplay between these records ultimately determines whether a BTTS outcome is statistically justified.
Key BTTS Performance Metrics
While gut instinct and team reputation carry weight among casual bettors, data-driven metrics offer far more reliable signals for identifying BTTS opportunities. Analyzing BTTS trends through key performance indicators sharpens BTTS strategies considerably.
Four metrics deserve priority attention:
- BTTS Percentage – Rates above 50% signal favorable match conditions for both teams scoring.
- xG For – Higher attacking expected goals indicate genuine scoring capability, not statistical noise.
- xG Against – Increased figures expose defensive vulnerabilities that skilled bettors exploit consistently.
- Shots on Target – Greater volume correlates directly with improved scoring reliability across matches.
Additionally, teams conceding over 1.0 goals per match represent prime BTTS candidates. Cross-referencing these metrics rather than relying on isolated figures produces the most actionable findings.
Analyzing Defensive and Offensive Records
Beyond surface-level win-loss records, the statistics that genuinely predict BTTS outcomes cluster around two measurable axes: how effectively teams create chances and how consistently they fail to prevent them.
Expected goals metrics quantify offensive strategies with precision — high xG figures for both sides signal genuine scoring probability rather than fortunate finishes. Teams averaging over 1.0 goals conceded per match reveal structural defensive errors that sharp bettors exploit consistently.
Shots on target averages reinforce xG findings, confirming whether attacking intent translates into sustained pressure. BTTS percentages, particularly in high-scoring environments like the Bundesliga’s 55-60% rate, establish baseline expectations per league context.
Head-to-head records complete the picture, identifying recurring patterns between specific opponents where both offensive output and defensive vulnerability historically converge into reliable BTTS opportunities.
What Leagues and Matches Produce the Most BTTS Results?
Certain leagues consistently generate more Both Teams to Score outcomes than others, largely owing to structural and cultural factors that prioritize attacking play over defensive solidity. Bundesliga Insights reveal a BTTS rate of 55–60%, while Eredivisie Trends confirm approximately 58%, both reflecting leagues where defensive vulnerabilities remain persistent.
Key match environments producing heightened BTTS results include:
- Bundesliga fixtures — high-tempo attacking systems expose defensive gaps regularly.
- Eredivisie matches — weak defensive records create consistent scoring opportunities for both sides.
- MLS contests — fluctuating team performances produce a steady 55% BTTS rate.
- High-stakes fixtures — relegation battles and playoffs compel both teams to attack, naturally increasing BTTS outcomes.
Teams averaging over 1.2 goals scored and conceding above 1.0 per game represent the strongest BTTS candidates league-wide.
BTTS Vs Over 2.5 Goals: Which Market Fits Your Bet?

Two of the most popular goal-based betting markets — BTTS and Over 2.5 Goals — operate on fundamentally different logic, and understanding that distinction is vital for selecting the right vehicle for a given match. BTTS strategies demand that both sides find the net, making defensive weaknesses and offensive strengths on each team significant considerations. Over 2.5 analysis, by contrast, permits one team to dominate scoring entirely. Match dynamics, league differences, and scoring trends all influence which market carries less risk. Bundesliga fixtures, for instance, support both markets, yet they can separate sharply based on match context. Betting preferences ultimately drive selection, but disciplined risk comparison and smart stake management determine long-term viability. Neither market is universally superior — each rewards bettors who align selection with evidence.
The Biggest BTTS Betting Mistakes to Avoid
Five critical mistakes consistently undermine BTTS bettors, each rooted in analytical gaps that erode long-term profitability. Common misconceptions drive poor decisions, while strategic approaches demand disciplined scrutiny of multiple variables.
- Ignoring defensive metrics — weak defenses signal BTTS value; strong ones eliminate it.
- Discarding recent form — current goal-scoring and conceding trends outweigh historical averages.
- Misreading high-scoring fixtures — offensive reputation means little without evaluating defensive vulnerabilities simultaneously.
- Overlooking match context — high-stakes encounters suppress scoring unpredictably, distorting expected outcomes.
Additionally, absent key attackers fundamentally alter a team’s scoring capacity, yet bettors routinely ignore injury reports. Strategic approaches that incorporate defensive data, form analysis, and team news consistently outperform impulsive selections built on surface-level assumptions.